I've been trying out improvements of setup with my $8 diffraction grating spectroscope, and camera.
Best I've come up so far is as attached.
The lower spectrum is of one of my plasmas, with seemingly a clear set of blue H-Balmer emissions.
However, I also took one of a bright source for comparison - the reflection of a compact fluorescent bulb against a white wall - and got the upper spectrum which also seems to have something like the blue H-Balmer set. Why would I get H-Balmer off of a CFL? Is that to be expected or is this the spectrum of sulphur and/or something else completely (and does that throw up any questions on the spectrum of my plasma, though there are surely no sulphur compounds in that)?
Spectrum interpretation...
-
Chris Bradley

- Posts: 2930
- Joined: Fri May 02, 2008 7:05 am
- Real name:
Spectrum interpretation...
- Attachments
-
-
Carl Willis

- Posts: 2841
- Joined: Thu Jul 26, 2001 7:33 pm
- Real name: Carl Willis
- Location: Albuquerque, New Mexico, USA
- Contact:
Re: Spectrum interpretation...
Chris,
Fluorescent lamps are mercury discharge lamps.
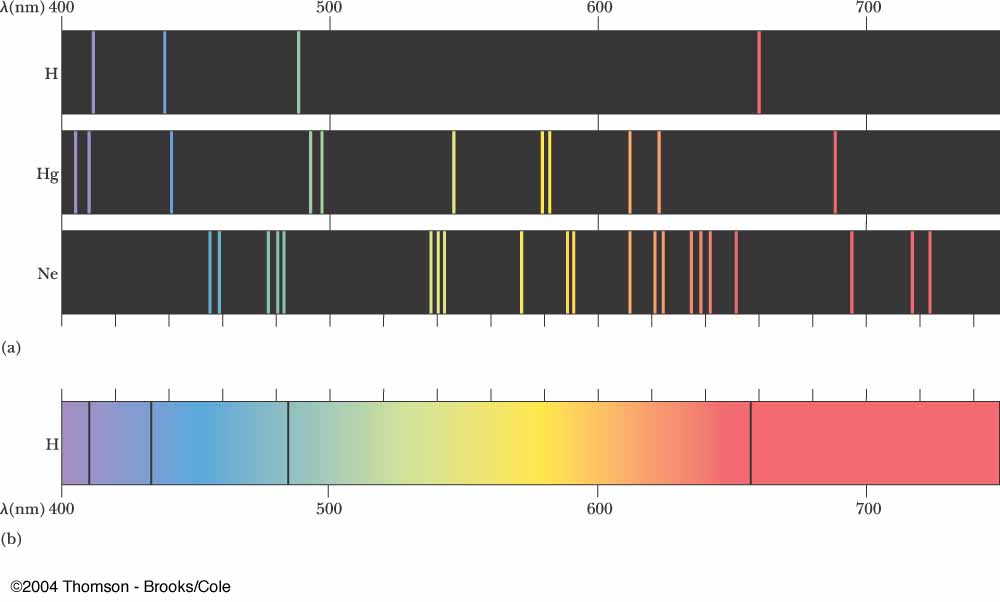
I did a Google search for "mercury emission spectrum" and among the photos leading the results, you get this one comparing hydrogen and mercury spectra, showing some similar lines at the shorter wavelengths:
http://www.physics.umd.edu/courses/Phys ... pectra.jpg
Looking at your own discharge spectrum made with an $8 grating, it's awfully hard to tell whether you have Balmer lines or something else. The "lines" are fat and fuzzy. It's consistent with lots of spectra, among them being hydrogen. The lines from the mercury fluorescent lamp are probably mostly due to the emission spectrum of mercury, because we know mercury is in the lamp and because the spectrum is consistent with that.
-Carl
Fluorescent lamps are mercury discharge lamps.
I did a Google search for "mercury emission spectrum" and among the photos leading the results, you get this one comparing hydrogen and mercury spectra, showing some similar lines at the shorter wavelengths:
http://www.physics.umd.edu/courses/Phys ... pectra.jpg
Looking at your own discharge spectrum made with an $8 grating, it's awfully hard to tell whether you have Balmer lines or something else. The "lines" are fat and fuzzy. It's consistent with lots of spectra, among them being hydrogen. The lines from the mercury fluorescent lamp are probably mostly due to the emission spectrum of mercury, because we know mercury is in the lamp and because the spectrum is consistent with that.
-Carl
-
Chris Bradley
- Posts: 2930
- Joined: Fri May 02, 2008 7:05 am
- Real name:
Re: Spectrum interpretation...
Thanks for finding that link with the comparison. Seems to put things all in order. I was just a bit surprised to see a very similar spectrum!
Naturally, what can one expect from a diffraction grating and a plasma you can barely see, let alone take a good picture of it through a slit? But I sure as heck haven't got mercury in there, so I think you've put that one to bed.
I'm doing the best I can, with what I can get. If anyone wishes to donate spectroscope equipment, I'll be happy to receive. I've never seen anything available in the UK in my price range. They are emissions from within both a strong magnetic and an electric field whose strength I don't really know, so maybe I'd still get a spread-out colour even if I could get a better device. Some reasonable interpretation is required - air at a couple of microns? What else would those lines be, but H in the lingering water vapour?
-
richnormand
- Posts: 307
- Joined: Sat Aug 27, 2005 8:30 am
- Real name: rich normand
Re: Spectrum interpretation...
Here is a link with similar resolution of cfl.
http://web.ncf.ca/jim/misc/cfl/
As noted by Carl they have a mercury plasma so no surprises.
Wikipedia has a good writeup and a higher resolution link with each line identified for discharge and rare earth in the phosphor wall coating.
http://en.wikipedia.org/wiki/File:Fluor ... belled.png
http://web.ncf.ca/jim/misc/cfl/
As noted by Carl they have a mercury plasma so no surprises.
Wikipedia has a good writeup and a higher resolution link with each line identified for discharge and rare earth in the phosphor wall coating.
http://en.wikipedia.org/wiki/File:Fluor ... belled.png
-
Chris Bradley
- Posts: 2930
- Joined: Fri May 02, 2008 7:05 am
- Real name:
Re: Spectrum interpretation...
You motivated me to reduce the slit width and repeat. I don't think I can practically reduce it any more, the rest is a function of the diffraction grating.
Clearly much improved spectrum of the CFL, but not sure I'll be able to get anything from the plasma anymore with that aperture (slit) size... I'll have a go, and we'll see....
Not a bad effort for $8, I think.
.
Clearly much improved spectrum of the CFL, but not sure I'll be able to get anything from the plasma anymore with that aperture (slit) size... I'll have a go, and we'll see....
Not a bad effort for $8, I think.
.
- Attachments
-
-
Richard Hester
- Posts: 1519
- Joined: Thu Jul 05, 2001 12:07 am
- Real name:
Re: Spectrum interpretation...
Even cheaper than an $8 spectroscope is a CD, which acts like a diffraction grating. You get interesting spectra from both a compact fluorescent lamp and a low pressure sodium street lamp. With the street lamp, you get those big sodium "D" lines, as well as the spectrum of the neon filler gas.
Re: Spectrum interpretation...
With the narrower slit you seem to be getting some decent sharp lines.
Ocean Optics makes "relatively" cheap spectrometers based on diffraction gratings and inexpensive linear CCD arrays (ours were 2048 pixel). In principle, if you can get into the guts of an image file (probably easier with a .bmp), you ought to be able to derive relative intensity of any given line across the image, and derive line shape. There are enough pixels across a high-res photograph that this ought to be possible.
The spectrometer I ordered for fusion plasmas had the tightest bandwidth Ocean Optics offered, 90 nm, centered on the blue-green 486 Balmer H-beta line. That one is a singlet, versus a doublet at -alpha. On that spectrometer we could also see the huge mercury peak from flourescent lights, but it was quite distinct from hydrogen.
I also had a similar spectrometer for the full visible range, and it showed the flourescents had a lot of action going across the yellow to red end of the spectrum, nearly like an incandescent filament, due to the phosphor mix intended to make more or less white light.
I've tried using a CD as an eyeball spectrometer, and it definitely spots the blue mercury line in a flourescent light.
Re: Spectrum interpretation...
Chris -
Interesting results, to be sure. Looking at your first picture, I was going to suggest reducing the slit width. You can get low cost replica transmission and reflection gratings, from Edmund Optical .. (Edmund Scientific of old.) ...They're US based in NJ, right outside of Phila., so they're not much farther from you, than from me in Calif.
I have a reasonably decent resolution spectroscope that I built from a cardboard tube and one of Edmund's transmission gratings in a 35 mm slide frame. They sell them by the dozens that way for school science projects. You can probably get to 50 um slit width with a couple of blackened razor blades.
As I recall, the commercial monochromators, (I had a Jarrell- Ash, 0.25 m Ebert type) which had interchangeable slits, they used about 25 um wide slits at their highest resolution. You don't get much light through the very narrow a slit, and eventually its own diffraction pattern interferes with the resolution. Your camera seems to do well capturing the spectrum.
Dave Cooper
-
JohnCuthbert
- Posts: 339
- Joined: Mon Aug 19, 2002 4:30 pm
- Real name:
Re: Spectrum interpretation...
This is interesting stuff, but it's the nuclei that fuse and they don't have a UV/Vis spectrum.
-
Dan Tibbets
- Posts: 578
- Joined: Thu Apr 17, 2008 1:29 am
- Real name:
Re: Spectrum interpretation...
A software program for stellar spectrum analysis that might be usefull.
http://www.astrosurf.com/vdesnoux/
Dan Tibbets
http://www.astrosurf.com/vdesnoux/
Dan Tibbets
-
Chris Bradley
- Posts: 2930
- Joined: Fri May 02, 2008 7:05 am
- Real name:
Re: Spectrum interpretation...
I've been making steady improvements to my technique to improve imaging of very dim plasmas. The latest results are as here. This is a spectrum of one of my 'crimzon doughnut' plasmas. I can't vouch for the scale. Much more to see now, compared with first attempt, above. Interpretations welcome.
.
.
- Attachments
-
-
Richard Hester
- Posts: 1519
- Joined: Thu Jul 05, 2001 12:07 am
- Real name:
Re: Spectrum interpretation...
Chris - aim your spectroscope at a low pressure sodium street light, and you can at least calibrate on the intense sodium "D" line.
-
Chris Bradley
- Posts: 2930
- Joined: Fri May 02, 2008 7:05 am
- Real name:
Re: Spectrum interpretation...
Sodium street light (high pressure type, judging by the brightness of it):
I will aim to improve this spectrum (actually quite difficult as it is a *very* bright source but with no background illumination of the scale, the inverse of the dim plasmas).
Looks to me like the 589nm and 569nm are showing up at around indicated 609 and 589, but the lower 475 and 466 are about right. So I'd judge this to say that it suggests the scale is about right in blue, drifiting to 20nm over-indicating at the red-end.
.
- Attachments
-